Every DBA has a handful of go to scripts that they know where to find even before the coffee has kicked in. This is mine for TempDB. Any time I get an alert saying TempDB Log or Data Files are filling up unusually and unexpectedly, this is the exact script I open every single time. If you’re building out your own DBA toolbelt, I’d argue this is one of the more useful scripts to have on hand.
(Quick aside: you do have alerts configured for TempDB Log and Data File growth, don’t you? If you don’t, stop reading this post right now and go set some up. 🙂 Finding out TempDB Log or Data Files are full because a user finally complained is a much worse way to start your morning than getting a heads up from a monitor.)
👉 Cool story, but just give me the script
Why TempDB Deserves Its Own Runbook
TempDB is shared infrastructure. Every database on the instance uses it for worktables, sort and hash spills, temp tables and table variables, index rebuilds using SORT_IN_TEMPDB, and row versioning for Read Committed Snapshot Isolation (RCSI) or explicit snapshot isolation. Because it’s shared, one misbehaving session in a single database can fill up TempDB and start causing problems everywhere else on the instance. That’s exactly why “TempDB is filling up” deserves a fast, repeatable response instead of ad hoc troubleshooting while everyone waits on you.
There are two flavors of “TempDB is filling up” you’ll typically run into:
- The TempDB Transaction Log is full or growing rapidly.
- The TempDB Data Files are running low on free space or auto-growing.
The scripts below walks through both, plus a deeper look at the Version Store specifically, since that’s a sneaky third cause that doesn’t always show up as an obvious “one SPID is hogging everything” pattern.
Section 1: Is the TempDB Log Actually the Problem?
First things first, look at actual log usage:
--see current Log File usageselect cast(total_log_size_in_bytes*1.0/1024/1024/1024 as numeric(10,2)) [Total_Log_Space_In_GB] ,cast(used_log_space_in_bytes*1.0/1024/1024/1024 as numeric(10,2)) [Used_Log_Space_In_GB] ,cast((total_log_size_in_bytes - used_log_space_in_bytes)*1.0/1024/1024/1024 as numeric(10,2)) as [Free_Log_Space_In_GB] ,format((cast(used_log_space_in_bytes*1.0/1024/1024/1024 as numeric(10,2)) / cast(total_log_size_in_bytes*1.0/1024/1024/1024 as numeric(10,2))), 'P2') as [Current_Percent_Full]from sys.dm_db_log_space_usage;
This pulls straight from sys.dm_db_log_space_usage and converts everything to GB so it’s readable at a glance, rather than staring at raw byte counts. If the log is sitting above roughly 70% full and climbing, you’ve likely confirmed the log itself is the issue, and it’s time to take action.

Next, run this in the context of TempDB itself:
use tempdb;go--Check to see if there is a long running transaction in user DBs:dbcc opentran;
dbcc opentran tells you whether there’s an old, still-open transaction lurking somewhere in a user database. TempDB’s own log can’t truncate space held open by a long running transaction elsewhere on the instance, so this is always worth a quick look first. If it returns a result, note the SPID and the start time. Likely anything open more than 10 to 15 minutes is worth investigating further (more on digging into a specific SPID below). Acceptable durations for an open transaction will vary by shop, so make sure you know what’s normal in your environment.
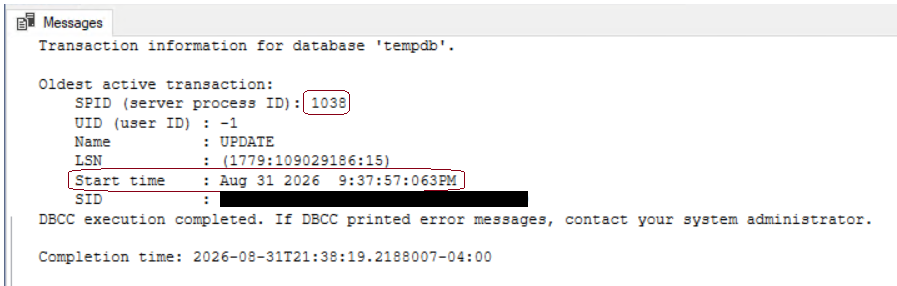
If you’ve discovered what SPID is the issue, skip down to Section 3: Digging into a Specific SPID
Section 2: TempDB Data File Space
If the log looks healthy but you’re seeing Data File space pressure, use the scripts below to have a look.
Where Is the Space Actually Going?
-- Buckets of TempDB Usage (GB):SELECT (SUM(unallocated_extent_page_count)*1.0/131072) AS [Free space(GB)] ,(SUM(version_store_reserved_page_count)*1.0/131072) AS [Used Space by VersionStore(GB)] ,(SUM(internal_object_reserved_page_count)*1.0/131072) AS [Used Space by InternalObjects(GB)] ,(SUM(user_object_reserved_page_count)*1.0/131072) AS [Used Space by UserObjects(GB)]FROM tempdb.sys.dm_db_file_space_usage;

This breaks TempDB’s data file space into four buckets: free space, Version Store, internal objects (worktables, spools, sort and hash spills), and user objects (actual temp tables and table variables). Whichever bucket is the largest tells you which direction to keep digging. If Internal Objects or User Objects dominate, head to the next query. If Version Store dominates, skip ahead to the section below on that specifically, since the troubleshooting path is a little different.
Which Session Is Using the Most Space?
-- Top sessions with objects in tempdb (grouped by SPID):select top 20 session_id as [SPID], sum(user_objects_alloc_page_count + internal_objects_alloc_page_count) as [SpaceUsed_Pages], cast(round((sum(user_objects_alloc_page_count + internal_objects_alloc_page_count) * 8.0) / (1024 * 1024), 2) as decimal(18,2)) as [SpaceUsed_GB]from tempdb.sys.dm_db_task_space_usagegroup by session_idorder by 2 desc;
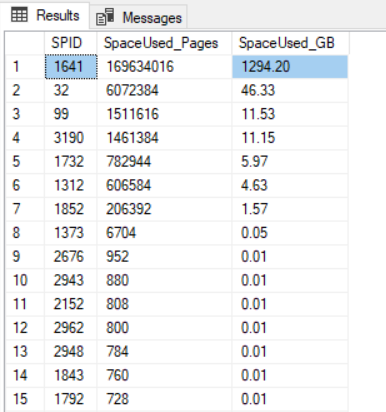
This groups TempDB space usage by SPID and converts it to GB, so instead of scrolling through raw page counts, you get an ordered list of exactly who is using the most space right now. The top SPID isn’t automatically guilty, but it’s the best starting point for further investigation. Take that SPID and move on to Section 3 below.
When Version Store Is the Biggest Bucket
If the buckets query above shows Version Store as the dominant consumer, the “top SPID by space used” query won’t necessarily point you at the culprit, because Version Store growth is driven by open snapshot transactions, not by a session’s own allocated objects. TempDB grows this way when a long running query or procedure explicitly sets the transaction isolation level to snapshot (or the database has RCSI enabled) and that transaction stays open for a while. Every row modified anywhere while that transaction is open has to keep an old version around in TempDB until it’s no longer needed, and the longer the transaction stays open, the more it accumulates.
This is the query I go to for that specific scenario:
-- Oldest active snapshot transaction and how long it's been openSELECT dtst.transaction_id, dtst.session_id, dtst.elapsed_time_seconds, dtst.is_snapshot, des.login_name, des.host_name, des.program_name, der.status, der.command, der.wait_typeFROM sys.dm_tran_active_snapshot_database_transactions dtstLEFT JOIN sys.dm_exec_sessions des ON dtst.session_id = des.session_idLEFT JOIN sys.dm_exec_requests der ON dtst.session_id = der.session_idORDER BY dtst.elapsed_time_seconds DESC;
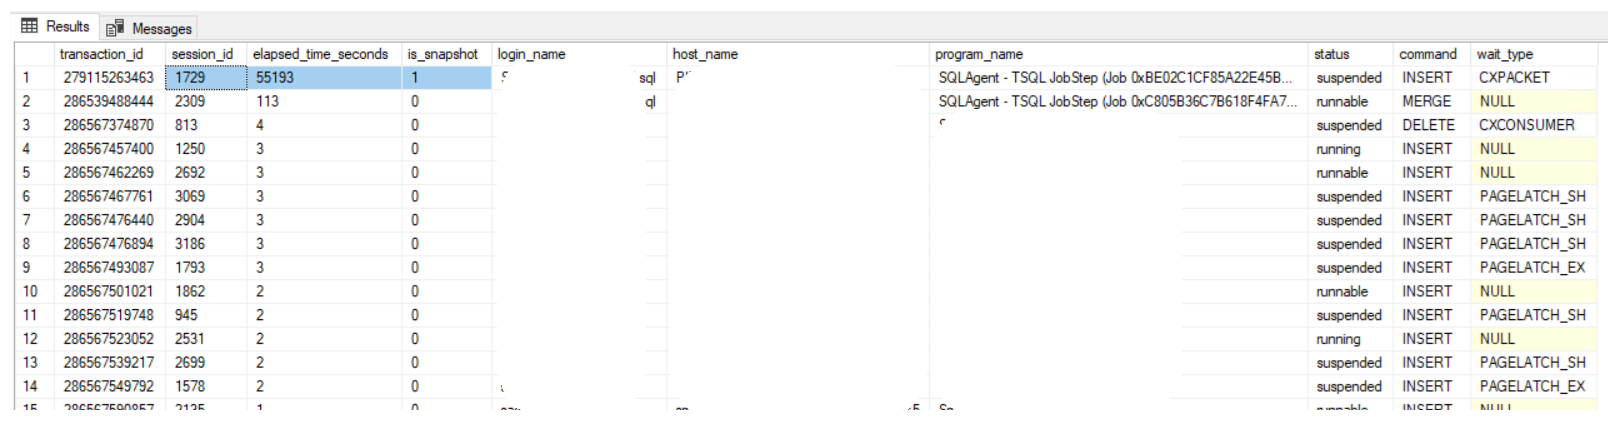
Instead of ranking by space consumed, this ranks every active snapshot transaction by how long it’s been open, since duration is exactly what drives Version Store bloat. It also pulls in login_name, host_name, and program_name from sys.dm_exec_sessions, which is usually enough to point you straight at the offending application or job without any further guesswork. Whatever SPID lands at the top of that list is your next stop.
Section 3: Digging into a Specific SPID
Once you’ve got a SPID from either Section 1 or Section 2, here’s the toolkit I use to figure out what it’s actually doing:
--Tools to check what the session is doing (SPID 1234 as an example):dbcc inputbuffer (1234);execute sp_whoisactive 1234, @get_outer_command = 1;select * from sys.dm_exec_requestscross apply sys.dm_exec_sql_text(sql_handle)cross apply sys.dm_exec_query_plan(plan_handle)where session_id in (1234);
dbcc inputbuffershows you the last statement submitted by that SPID; a fast, no-frills first look.sp_whoisactivegives you a much richer picture: current wait type, blocking chain, the outer calling command, and more, all in one result set. If you’re not already running this on your servers, go get it. Credit:sp_whoisactivewas written by Adam Machanic, and it’s genuinely one of the best free tools in the SQL Server DBA world. Grab it from his site at whoisactive.com if it’s not already installed everywhere it should be.- The
sys.dm_exec_requestsquery with the cross applies pulls the live SQL text and execution plan directly for that session, which is handy when you want to see exactly what’s running without digging through the plan cache.
If you need to go find the query plan for a specific stored procedure after the fact (say, the SPID has already finished, or you want to see how often it’s being called), this pulls it from the plan cache instead:
--Capture the query plan if/as needed:use [<database>] -- replace with database where object livesselect usecounts,refcounts, cacheobjtype, objtype, [text sql], query_planfrom sys.dm_exec_cached_planscross apply sys.dm_exec_sql_text(plan_handle)cross apply sys.dm_exec_query_plan(plan_handle)where text like '%<replace_with_the_name_of_the_offending_proc>%' -- if applicableand usecounts > 1order by usecounts desc;
A Word on Killing SPIDs
Once you’ve identified the root cause, KILL <spid> is available, but use it carefully. A SPID in the middle of a large data modification can take just as long, sometimes longer, to roll back as it did to run in the first place. Killing it doesn’t free up the space right away; it can make things worse for a while before it gets better. If you’re not sure whether a kill is safe, it’s worth a second opinion before you pull the trigger.
The Full Script
Here’s the whole thing in one place, in the order I actually run it: log space first, then data file space (including the Version Store check), then the SPID-specific tools.
--Run scripts in the context of TempDB!use tempdb;go/** Section 1 - TempDB Transaction Log Growth **/--Check to see if there is a long running transaction in user DBs:dbcc opentran;--see current Log File usageselect cast(total_log_size_in_bytes*1.0/1024/1024/1024 as numeric(10,2)) [Total_Log_Space_In_GB] ,cast(used_log_space_in_bytes*1.0/1024/1024/1024 as numeric(10,2)) [Used_Log_Space_In_GB] ,cast((total_log_size_in_bytes - used_log_space_in_bytes)*1.0/1024/1024/1024 as numeric(10,2)) as [Free_Log_Space_In_GB] ,format((cast(used_log_space_in_bytes*1.0/1024/1024/1024 as numeric(10,2)) / cast(total_log_size_in_bytes*1.0/1024/1024/1024 as numeric(10,2))), 'P2') as [Current_Percent_Full]from sys.dm_db_log_space_usage;/** Section 2 - TempDB Data File Usage Growth **/-- Buckets of TempDB Usage (GB):SELECT (SUM(unallocated_extent_page_count)*1.0/131072) AS [Free space(GB)] ,(SUM(version_store_reserved_page_count)*1.0/131072) AS [Used Space by VersionStore(GB)] ,(SUM(internal_object_reserved_page_count)*1.0/131072) AS [Used Space by InternalObjects(GB)] ,(SUM(user_object_reserved_page_count)*1.0/131072) AS [Used Space by UserObjects(GB)]FROM tempdb.sys.dm_db_file_space_usage;-- Top sessions with objects in tempdb (grouped by SPID):select top 20 session_id as [SPID], sum(user_objects_alloc_page_count + internal_objects_alloc_page_count) as [SpaceUsed_Pages], cast(round((sum(user_objects_alloc_page_count + internal_objects_alloc_page_count) * 8.0) / (1024 * 1024), 2) as decimal(18,2)) as [SpaceUsed_GB]from tempdb.sys.dm_db_task_space_usagegroup by session_idorder by 2 desc;-- If Version Store is the biggest bucket above, find the oldest active snapshot transaction:SELECT dtst.transaction_id, dtst.session_id, dtst.elapsed_time_seconds, dtst.is_snapshot, des.login_name, des.host_name, des.program_name, der.status, der.command, der.wait_typeFROM sys.dm_tran_active_snapshot_database_transactions dtstLEFT JOIN sys.dm_exec_sessions des ON dtst.session_id = des.session_idLEFT JOIN sys.dm_exec_requests der ON dtst.session_id = der.session_idORDER BY dtst.elapsed_time_seconds DESC;/** Section 3 - Look into specifics for high-usage SPIDs **/--Tools to check what the session is doing (SPID 1234 as an example):dbcc inputbuffer (1234);execute sp_whoisactive 1234, @get_outer_command = 1;select * from sys.dm_exec_requestscross apply sys.dm_exec_sql_text(sql_handle)cross apply sys.dm_exec_query_plan(plan_handle)where session_id in (1234);--Capture the query plan if/as needed:use [<database>] -- replace with database where object livesselect usecounts,refcounts, cacheobjtype, objtype, [text sql], query_planfrom sys.dm_exec_cached_planscross apply sys.dm_exec_sql_text(plan_handle)cross apply sys.dm_exec_query_plan(plan_handle)where text like '%<replace_with_the_name_of_the_offending_proc>%' -- if applicableand usecounts > 1order by usecounts desc;
Further Reading
If you want to go deeper on TempDB internals beyond this troubleshooting flow, Paul Randal’s TempDB category on SQLskills is a great next stop: sqlskills.com/blogs/paul/category/tempdb.
Wrapping Up
This is the exact script I open any time I get an alert about TempDB Log or Data Files filling up unusually and unexpectedly. It won’t fix the root cause for you, but it will get you from “something’s wrong with TempDB” to “here’s the specific SPID and query responsible” in a couple of minutes, and hopefully before your customers ever notice. 🙂 Keep it in your toolbelt, and again, go set up those TempDB alerts if you haven’t already. 🙂
 Ryan Ackerland's Blog