How to Avoid a Sneaky Trap When Scripting Out Index Columns from SQL Server sys.index_columns

I ran into a head-scratcher recently while doing some routine index inventory work, and it’s the kind of thing that will absolutely burn you if you don’t know it’s out there. (Ask me how I know. 🙂 ) I went looking to see if anyone had already written this up, and the closest I found was a 2011 SQLServerCentral forum thread where Gail Shaw (@SQLintheWild) diagnosed the same root cause and even said “worth a blog post, sometime.” I didn’t find any relevant blog posts, so here goes… 🙂 There’s a full demo script included at the bottom so you can reproduce it yourself.

The Setup

I was running a standard “inventory all indexes on this table” query against a SQL Server instance; the kind of script every DBA has a version of, pulling key columns and included columns out of sys.index_columns so you can see what’s already there before adding anything new. (Column and table names below are genericized from the real ones I was working with, but the behavior is identical.)

The results came back showing the clustered primary key with RecordId leading the key. That didn’t line up with what I expected, so I went looking for why.

I’d first noticed something was off while comparing my inventory query’s results against what was checked into source control (Git) for this table’s DDL; the column order didn’t match the repo. Thinking the Git version might just be stale, I scripted out the table directly from the live server to get the ground truth. That scripted DDL showed the clustered index defined with RegionId as the leading key column, not RecordId, and it matched what was in Git; it was my query that was the odd one out. That’s what sent me looking for an explanation.

I fired up Claude and pasted in the query, the scripted DDL, and the actual result set into a prompt and asked it to reconcile the discrepancy. Within a couple of exchanges it had zeroed in on the two catalog view columns doing the damage, which saved me a fair amount of digging through Books Online myself. As a side note, I’ve been leaning on Claude more and more for this kind of script troubleshooting work, and this was a good example of why: it’s fast at diagnosing query issues and pinpointing root cause.

The Root Cause

The problem lives in sys.index_columns, and specifically in confusing two columns that sound like they’d tell you the same thing but don’t:

  • key_ordinal: the column’s position within the index key, as currently defined. This is what SSMS uses when it scripts out CREATE TABLE / CREATE INDEX DDL, so it’s the authoritative source for “what order are the key columns really in, right now.”
  • index_column_id: an internal identifier assigned to a column the first time it’s added to an index. It is not renumbered if the key order is changed later. It’s unique within the index, but it doesn’t mean “current position.”

My inventory query was building column order like this:

ROW_NUMBER() over (partition by sc.is_included_column order by sc.index_column_id) ColPos


That’s fine for included columns, since key_ordinal is always 0 for those anyway, so there’s nothing else to sort by. It’s a landmine for key columns, though. Sorting key columns by index_column_id only gives you the correct order if the index was created once, in its current column order, and never touched again.

Why the PK Was Out of Sync

Here’s the part that surprised me: this doesn’t require some tangled history of rebuilds and migrations to happen. It can happen the moment the table is created, and it comes down to one specific circumstance for clustered indexes: the column’s position in sys.index_columns.index_column_id gets tied to the column’s physical position in the table (its column_id in sys.columns), not to the order you declared in the key.

So if you create a table where the physical column order doesn’t match the clustered key order you want, index_column_id will follow the physical layout while key_ordinal correctly follows what you declared. Two columns, one index, two different “orders,” both technically true depending on which one you ask.

This can also happen after the fact, if a clustered PK’s key order gets changed later via a DROP_EXISTING rebuild or a drop-and-recreate with a different column order; key_ordinal updates to reflect the new key order, but index_column_id doesn’t get renumbered to match. Either way, the fix is the same, and I worked with Claude to build a clean, minimal demo below so you can watch it happen on a throwaway table instead of just taking my word for it.

Proving It: A Demo You Can Run Yourself

Spin up a scratch table where the physical column order intentionally does not match the clustered key order you’re declaring:

-- Run this in a scratch/test database, not production
IF OBJECT_ID('dbo.Demo_KeyOrderTest', 'U') IS NOT NULL
DROP TABLE dbo.Demo_KeyOrderTest;
GO
CREATE TABLE dbo.Demo_KeyOrderTest
(
RegionId TINYINT NOT NULL, -- physically the 1st column in the table
RecordId INT NOT NULL, -- physically the 2nd column in the table
RecordDate DATETIME2(0) NOT NULL, -- physically the 3rd column in the table
CONSTRAINT PK_Demo_KeyOrderTest PRIMARY KEY CLUSTERED
(
RecordId ASC, -- declared key order: 1st
RecordDate ASC, -- declared key order: 2nd
RegionId ASC -- declared key order: 3rd
)
);
GO
INSERT INTO dbo.Demo_KeyOrderTest (RegionId, RecordId, RecordDate)
VALUES (1, 100, SYSDATETIME()), (2, 101, SYSDATETIME()), (3, 102, SYSDATETIME());
GO

I declared the clustered key as RecordId, RecordDate, RegionId, but the columns physically sit in the table as RegionId, RecordId, RecordDate. Now run this to see both orderings side by side:

SELECT
c.name AS ColumnName,
ic.key_ordinal,
ic.index_column_id,
ic.is_included_column
FROM sys.index_columns ic
JOIN sys.columns c
ON ic.object_id = c.object_id AND ic.column_id = c.column_id
JOIN sys.indexes i
ON ic.object_id = i.object_id AND ic.index_id = i.index_id
WHERE i.object_id = OBJECT_ID('dbo.Demo_KeyOrderTest')
AND i.is_primary_key = 1;

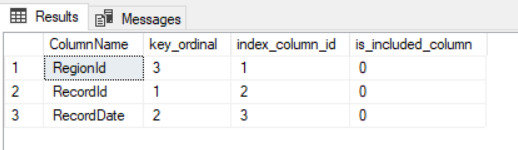
Look at the two ordinal columns: key_ordinal will show RecordId=1, RecordDate=2, RegionId=3, matching exactly what you declared in the CREATE TABLE statement. index_column_id will instead follow the physical column order (RegionId=1, RecordId=2, RecordDate=3). Sort the same result set by each column and you’ll get two different sequences out of the same three rows.

Now script out the table (right-click it in SSMS’s Object Explorer and choose Script Table As > Create to), and you’ll see the DDL correctly shows the clustered key as RecordId, RecordDate, RegionId, because SSMS is reading from key_ordinal, same as it should. Any query sorting by index_column_id instead will disagree with that DDL, and now you’ve reproduced the exact mismatch I ran into.

The Full Script: Before

This is the actual index inventory script I was running when I hit this. It’s a common style of script: pull every index on a table along with its key columns and included columns in one readable row per index. Point the WHERE clause at the demo table above and run it yourself:

/**************************************************************************************************************
1) Get a list of all currently existing indexes with keys and included columns. (Run on specific database.)
See what's out there already before considering new indexes.
**************************************************************************************************************/
select
schema_name(o.schema_id) as [Schema] , o.name ObjectName, i.name IndexName, i.index_id
,i.type_desc
,LEFT(list, ISNULL(splitter-1,len(list))) Columns
, SUBSTRING(list, indCol.splitter +1, 2056) includedColumns--len(name) - splitter-1) columns
,i.has_filter, i.filter_definition
from sys.indexes i
join sys.objects o on i.object_id = o.object_id
cross apply (select NULLIF(charindex('|',indexCols.list),0) splitter , list
from (select cast((
select case when sc.is_included_column = 1 and sc.ColPos = 1 then '|' else '' end +
case when sc.ColPos > 1 then ', ' else '' end + name
from (select sc.is_included_column, index_column_id, name
, ROW_NUMBER() over (partition by sc.is_included_column
order by sc.index_column_id) ColPos
from sys.index_columns sc
join sys.columns c on sc.object_id = c.object_id
and sc.column_id = c.column_id
where sc.index_id = i.index_id
and sc.object_id = i.object_id ) sc
order by sc.is_included_column
,ColPos
for xml path (''), type) as varchar(max)) list)indexCols ) indCol
WHERE o.name = 'Demo_KeyOrderTest'
and schema_name(o.schema_id) = 'dbo'
order by [Columns];

Run that against the demo table, and the Columns value for the primary key will come back in physical column order (RegionId, RecordId, RecordDate), not the declared key order (RecordId, RecordDate, RegionId). That’s the bug, staring back at you in a result grid that otherwise looks perfectly normal.

The Fix: After

The fix is one changed line: stop treating index_column_id as if it means “column order” for key columns. Sort key columns by key_ordinal, and only fall back to index_column_id for included columns, where key_ordinal doesn’t apply (it’s always 0 there, so there’s nothing else to sort by). I ran this past Claude to double check the CASE logic in the window function before trusting it:

/**************************************************************************************************************
1) Get a list of all currently existing indexes with keys and included columns. (Run on specific database.)
See what's out there already before considering new indexes.
FIXED: key columns now ordered by key_ordinal instead of index_column_id.
**************************************************************************************************************/
select
schema_name(o.schema_id) as [Schema] , o.name ObjectName, i.name IndexName, i.index_id
,i.type_desc
,LEFT(list, ISNULL(splitter-1,len(list))) Columns
, SUBSTRING(list, indCol.splitter +1, 2056) includedColumns--len(name) - splitter-1) columns
,i.has_filter, i.filter_definition
from sys.indexes i
join sys.objects o on i.object_id = o.object_id
cross apply (select NULLIF(charindex('|',indexCols.list),0) splitter , list
from (select cast((
select case when sc.is_included_column = 1 and sc.ColPos = 1 then '|' else '' end +
case when sc.ColPos > 1 then ', ' else '' end + name
from (select sc.is_included_column, index_column_id, key_ordinal, name
, ROW_NUMBER() over (partition by sc.is_included_column
order by case when sc.is_included_column = 0
then sc.key_ordinal
else sc.index_column_id end) ColPos
from sys.index_columns sc
join sys.columns c on sc.object_id = c.object_id
and sc.column_id = c.column_id
where sc.index_id = i.index_id
and sc.object_id = i.object_id ) sc
order by sc.is_included_column
,ColPos
for xml path (''), type) as varchar(max)) list)indexCols ) indCol
WHERE o.name = 'Demo_KeyOrderTest'
and schema_name(o.schema_id) = 'dbo'
order by [Columns];


Two changes from the original: key_ordinal is added to the inner column list so it’s available to sort by, and the ROW_NUMBER() window function now picks key_ordinal for key columns and only falls back to index_column_id for included columns. Run this version against the demo table and Columns will now correctly show RecordId, RecordDate, RegionId, matching the declared key order and matching what SSMS scripts out as DDL.

The Takeaway

If you’ve got a homegrown “list my indexes and their key/included columns” script, it’s worth checking whether it’s sorting by index_column_id or key_ordinal. A lot of scripts that circulate around the SQL Server community (mine included, apparently) work fine on the tables where they were first tested, simply because physical column order happened to match key order there, so the bug in the script never had a chance to surface. It’s the tables where physical layout and clustered key order diverge, whether that happened at creation or after a later rebuild, where this will bite you.

The fix takes one line. Finding out you needed it takes a lot longer, especially if you’re staring at a mismatch between a query and a DDL script in source control. If you’re not already in the habit of handing a query issue like this over to an AI assistant to help, hopefully this posts demonstrates how AI can help. It turned what could’ve been a painful afternoon of reading Microsoft Books Online into something I had wrapped up, demoed, and written up before lunch.

How to Monitor ADO.NET Connection Pools on Multiple SQL Servers with PowerShell

When using ADO.NET to make SQL Server database connections, connection pooling is used to minimize the cost of repeatedly opening and closing a new database connection. For a full explanation of connection pooling, see SQL Server Connection Pooling (ADO.NET)

The default maximum size of a connection pool is 100. If a connection is not properly closed/disposed in application code, it can remain in the connection pool unused until garbage collection cleans it up manually. The garbage collection process can take several minutes before closing an open connection. In a busy application with many database calls, the connection pool default max of 100 can be exhausted quickly if connections are not closed/disposed properly. When this happens, a typical exception would be: “Timeout expired.  The timeout period elapsed prior to obtaining a connection from the pool.  This may have occurred because all pooled connections were in use and max pool size was reached.”  

I recently encountered a scenario like this with extensive and complex application code that made connections to multiple SQL Servers and databases, so tracking down the improper connection string in the application code was proving difficult and time consuming. To aid in the troubleshooting, I created the PowerShell script below that monitors connection pool size and usage by host & host process id in order to narrow down the source of improper connection string(s).

To execute the script, two input files are necessary. First, create a “Servers.txt” file containing all the SQL Servers that your applications(s) make connections to. The Servers.txt file should be saved in the same directory as the PowerShell script and should look like this (Just replace “Server#” with your real server names.):

Servers

Secondly create a “FunctionLibrary.ps1” file containing the Invoke-SQLCmd2 and Write-DataTable custom functions. For more on adding these two functions and their use, see a full and thorough write up at the Hey, Scripting Guy! Blog. (Note that I’ve leveraged some of the concepts from this blog post into my own.) This FunctionLibrary.ps1 file should also be saved in the same directory as the other files listed in this post.

Finally, save the PowerShell Script below as a .ps1 file. (In the example shown here, I’ve named the file MonitorConnectionPools.ps1) Just replace YOUR_SERVER and YOUR_DATABASE with a real server name and database in your environment. A great place for this table would be on a DBA utility server or some other non-production server you use for administrative tasks.

#Add Functions
. ./FunctionLibrary.ps1</pre>
$ErrorActionPreference = "Stop"
$ServerList = Get-Content Servers.txt

$Query = "DECLARE @CurrentDate DATETIME = GETDATE();
SELECT  @@SERVERNAME AS 'ServerName', login_name, Host_name, host_process_id, COUNT(*) AS 'ConnectionCount', @CurrentDate AS 'CollectionTime'
FROM sys.dm_exec_sessions 
WHERE host_process_id IS NOT NULL
GROUP BY Host_name, login_name, host_process_id
HAVING COUNT(*) >= 25;"

foreach ($Server in $ServerList)
{
$Results = Invoke-Sqlcmd2 -Server $Server -Database master -Query $Query -As 'DataTable'

Write-DataTable -ServerInstance "YOUR_SERVER" -Database "YOUR_DATABASE" -TableName "ConnectionPoolMonitor" -Data $Results
}


Now that the PowerShell setup is in place, the next step is to create a table to store the results. This table should be created on the server you specified for YOUR_SERVER  in the database specified as YOUR_DATABASE in the MonitorConnectionPools.ps1 script above. To create the table structure, run the following SQL script:


SELECT  @@SERVERNAME AS 'ServerName'
,login_name
,host_name
,host_process_id
,COUNT(*) AS 'ConnectionCount'
,GETDATE() AS 'CollectionTime'
INTO [YOUR_DATABASE].dbo.[ConnectionPoolMonitor]
FROM sys.dm_exec_sessions 
WHERE host_process_id = -1
GROUP BY Host_name, login_name, host_process_id

Note that there is not a host_process_id of “-1”, so the SELECT returns no rows. This just creates the table with the desired structure in preparation for the real writes that will take place later.

Lastly, set up a SQL Server Job that calls your newly created MonitorConnectionPools.ps1 script. Set the Job up as follows:

Monitor Connection Pools Job Set up (Fixed)

In the example above, I’ve saved the MonitorConnectionPools.ps1, FunctionLibrary.ps1, and Servers.txt files in a local folder called “C:\Powershell\MonitorConnectionPools“. Use the Set-Location command to navigate to your saved file location.  Schedule the SQL Job to run every minute (or two) and it will write connection counts per host & host_process_id to the ConnectionPoolMonitor table created above. The script only collects connections in excess of 25 to avoid excess noise in the table. You can adjust the threshold as needed in the MonitorConnectionPools.ps1 file.

Once the SQL Job has been running for some time, review the data collected by querying the ConnectionPoolMonitor table. Look specifically for any instances of “100”  (or close to it) in ConnectionCount. If any connection pool timeout errors are seen in conjunction with the 100 connections, there’s likely an ADO.NET connection string that is missing a proper close/dispose command.

100 Connections

In the example above, host process 4732 using the login name “App_Login” running from the server “App_Host” is consuming all 100 of the connections available in the connection pool. If connection pool timeouts are seen during the time period associated with the CollectionTime above, this would be the culprit.

To determine exactly what the host process is (in this case, host process 4732), run the Get-Process -Id 4732 PowerShell command on the App_Host server. If the process is an IIS Worker Process (w3wp.exe), one more step is necessary to determine the correct application pool that is causing the issue. From the Command Line on the App_Host server, navigate to the inetsrv folder and execute appcmd list wps to get the name of each worker process:

appcmd list wps

Names obfuscated to protect the innocent. 🙂

This will show you the name of the application pool with the improperly closed/disposed connection so it can be easily located (and hopefully fixed!) in the application code.

This post is full of a lot of information, but hopefully it will help you on your way to monitoring and troubleshooting ADO.NET connection pooling with SQL Server!

How to Disable/Enable SQL Alerts on Multiple SQL Servers with PowerShell

When managing SQL Server AlwaysOn Availability Groups and/or standard Database Mirroring, setting up SQL Alerts should be standard protocol. (See this SQL Server Pro article for more background on this.) These types of Alerts can be configured to send e-mails any time the defined event occurs which is great for being notified of unexpected failovers and errors. However, the mass of e-mails generated during a regular planned maintenance that involves one or more failovers can be a little annoying. (Or maybe that’s just me… But if you’re reading this, maybe that’s just you as well. 🙂 I work with dozens of servers that have multiple Availability Groups and Mirrored Databases across them. Whenever we perform planned maintenance, the first thing I do is to disable all Mirroring and Availability Group related Alerts to spare my Inbox from the onslaught of unnecessary SQL Alert e-mails notifying me of the failovers. To do this quickly and efficiently, I’ve written a PowerShell script to disable/enable multiple Alerts on any number of servers automatically.

To execute the script, two input files are necessary. First, create a “Alert_Servers.txt” file containing all the servers with Alerts to be disabled. The Alert_Servers.txt file should be saved in the same directory as the PowerShell script and should look like this (Just replace “Server#” with your real server names.):

Alert Servers

Secondly create a “Alerts.txt” file containing the specific Alerts you want to disable/enable. This file should also be saved in the same directory as the PowerShell script and should look similar to this:

Alerts Text

In the example above, I’ve added all the specific Mirroring and Availability Group Alerts we set up as standard on all our servers. You can get a list of all configured Alerts on your servers by simply running this query:

SELECT name FROM msdb.dbo.sysalerts;

Just add new lines to this file for each Alert you’d like to disable/enable.

Finally, save the PowerShell Script below as a .ps1 file. (In the example shown below, I’ve named the file ToggleAlerts.ps1)

if (!(Get-PSSnapin -Name SQLServerCmdletSnapin100 -ErrorAction SilentlyContinue)) {
Add-PSSnapin SQLServerCmdletSnapin100}
if (!(Get-PSSnapin -Name SqlServerProviderSnapin100 -ErrorAction SilentlyContinue)) {
Add-PSSnapin SqlServerProviderSnapin100}

[System.Reflection.Assembly]::LoadWithPartialName("Microsoft.SqlServer.Smo") | Out-Null
[System.Reflection.Assembly]::LoadWithPartialName("Microsoft.SqlServer.Smo.Extended") | Out-Null

$Enabled = read-host "Enable or Disable? Please enter '1' or '0'"

if ($Enabled.ToString() -ne 1 -and $Enabled.ToString() -ne 0)
{
Write-Output "Only 1 and 0 are valid entries."
Exit
}

$ServerList = Get-Content Alert_Servers.txt
$AlertList  = Get-Content Alerts.txt

Write-Output "Please wait..."

foreach ($Server in $ServerList)
{
foreach ($Alert in $AlertList)
{
$Query = "IF EXISTS (SELECT 1 FROM msdb..sysalerts WHERE name = '$Alert')
EXEC msdb.dbo.sp_update_alert
@name = '$Alert'
,@enabled = $Enabled"

Invoke-Sqlcmd -Server $Server -Database "msdb" -Query $Query
}
}

if ($Enabled -eq 1)
{Write-Output "Alerts Enabled!"}

if ($Enabled -eq 0)
{Write-Output "Alerts Disabled!"}


Once you’ve created the ToggleAlerts.ps1 and the two text files, open a PowerShell window and execute the script. In the example below, I’ve saved all three files to the folder “C:\PowerShell\ToggleAlerts”. Enter “0” to disable alerts prior to the start of maintenance:

AlertsPS1

Once your failovers and maintenance are complete, run the same script again but enter “1” instead to re-enable the Alerts:

AlertsPS2

That’s all it takes to save your Inbox during a regular maintenance window!

How to Filter and Review SQL Error Logs on Multiple SQL Servers with PowerShell

When working with many related SQL Servers it can be helpful to review SQL Error Logs on multiple servers all at once while also filtering for certain types of error messages. There are many use cases for this script, but the most common use case I’ve encountered is to check for failed logins and connection timeouts after an Availability Group or Mirrored Database failover. I work in an environment with multiple Always On Availability Groups with dozens of webservers that connect to them via Listeners. When we do regular maintenance such as Windows Patching, we manually failover our Availability Groups as part of the patching process. With one run of this PowerShell script, we can ensure there are no failed logins or connection issues once the failovers and maintenance have been completed. Some of our Availability Groups span up to five Replicas, so there have been occasions where our Logins are out of sync.

To execute the script, two input files are necessary. First, create a “Servers.txt” file containing all the servers with error logs to review. The Servers.txt file should be saved in the same directory as the PowerShell script and should look like this (Just replace “Server#” with your real server names.):

Servers

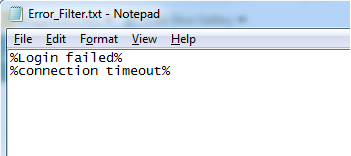
Secondly create a “Error_Filter.txt” file containing the specific error messages you’re interested in searching for. This file should also be saved in the same directory as the PowerShell script and should look similar to this:

Error Entries

In the example above, we’re looking for any error message containing “login failed” or “connection timeout”.  Any number of different filter criteria can be included in the search by simply adding a new line to this file.

Finally, save the PowerShell Script below as a .ps1 file. (In the example shown below, I’ve named the file CheckErrorLogs.ps1)

if (!(Get-PSSnapin -Name SQLServerCmdletSnapin100 -ErrorAction SilentlyContinue)) {
Add-PSSnapin SQLServerCmdletSnapin100}
if (!(Get-PSSnapin -Name SqlServerProviderSnapin100 -ErrorAction SilentlyContinue)) {
Add-PSSnapin SqlServerProviderSnapin100}

[System.Reflection.Assembly]::LoadWithPartialName("Microsoft.SqlServer.Smo") | Out-Null
[System.Reflection.Assembly]::LoadWithPartialName("Microsoft.SqlServer.Smo.Extended") | Out-Null

$DateLimit = read-host "Please enter a minimum date/time in the following format:
[YYYY-MM-DD HH:MM]   i.e. 2015-01-01 15:30
Leave blank to omit the date time filter.

Enter Date"

$ServerList = Get-Content Servers.txt
$ErrorList  = Get-Content Error_Filter.txt
$Results=@()

foreach ($Server in $ServerList)
{
foreach ($Error in $ErrorList)
{
$Query = "SET NOCOUNT ON
CREATE TABLE #ERRORLOG (LogDate DATETIME, ProcessInfo VARCHAR(64), [Text] VARCHAR(MAX))
INSERT INTO #ERRORLOG
exec sp_readerrorlog
SELECT @@SERVERNAME AS 'ServerName', LogDate, [Text] FROM #ERRORLOG
WHERE [Text] LIKE '$Error'
AND LogDate > '$DateLimit'
DROP TABLE #ERRORLOG"

$Results += Invoke-Sqlcmd -Server $Server -Database "master" -Query $Query
}
}

$Results | Out-GridView

Once you’ve created the CheckErrorLogs.ps1 and the two text files, open a PowerShell window and execute the script. In the example below, I’ve saved all three files to the folder “C:\PowerShell\ReadSQLErrorLogs”.

Call CheckErrorLogs Small2

Enter a minimum date to filter for recent error messages only, or leave it blank to get all error messages in the current error log.

Enter Date Small

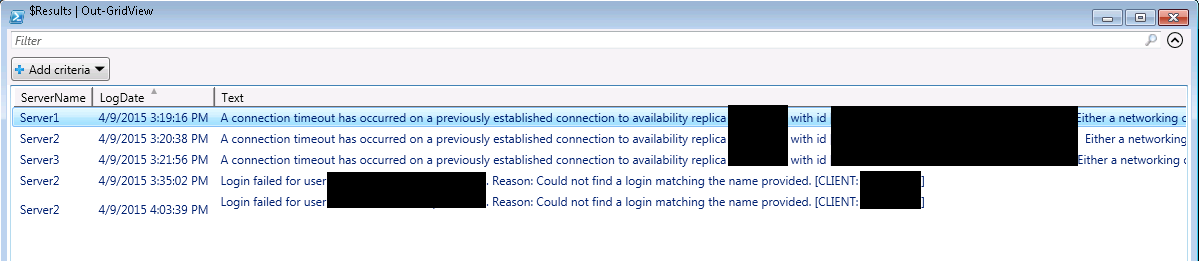
Finally, the results are output to a grid view for easy review and sorting.

Error Log Results w blank boxes Small2

Hopefully, this will save you a lot of time and effort when you need to review multiple SQL error logs!

How to Check Instant File Initialization and Lock Pages in Memory on All Your SQL Servers with PowerShell

For performance reasons, it is generally recommended that the Windows Service Account used by SQL Server be given permissions to Perform Volume Maintenance Tasks (i.e. Instant File Initialization) and to Lock Pages in Memory. (For more on why these permissions should be granted, see Jes Schultz Borland’s Will Instant File Initialization Really Help My Databases? and Jonathan Kehayias’ Great SQL Server Debates: Lock Pages in Memory.)

I work in an environment with dozens of production SQL Servers with seasonal peak workloads occurring twice yearly. One of my team’s tasks prior to each peak season is to confirm that each of our production SQL Servers have these specific permissions enabled. This can be accomplished by logging on manually to each server and reviewing the User Rights Assignments of the Local Security Policy. But who has the time for that?? (Or, this could be a great job for the intern… 🙂 To accomplish this task efficiently via automation, I’ve written a PowerShell script that will iterate through a list of servers and return the requested Security Policy information.

To execute the script, you’ll need to create a “Servers.txt” file containing all the servers to check. The Servers.txt file should be saved in the same directory as the PowerShell script and should look like this (Just replace “Server#” with your real server names.):

Servers

Next, save the PowerShell Script below as a .ps1 file. (In the example shown below, I’ve named the file ValidatePermissions.ps1)

$ServerList = Get-Content Servers.txt

foreach ($Server in $ServerList)
{

Invoke-Command -ComputerName $Server -ScriptBlock {

Set-Location C:\

$LocalSvr = get-content env:computername

$proc = Get-CimInstance Win32_Process -Filter “name = 'sqlservr.exe'”
$CimMethod = Invoke-CimMethod -InputObject $proc -MethodName GetOwner

$objUser = New-Object System.Security.Principal.NTAccount($CimMethod.Domain, $CimMethod.User)
$strSID = $objUser.Translate([System.Security.Principal.SecurityIdentifier])
$NTName = $strSID.Value

$ManageVolumePriv = 0
$LockPagesPriv = 0

secedit /export /areas USER_RIGHTS /cfg UserRights.inf /quiet

$FileResults = Get-Content UserRights.inf

Remove-Item UserRights.inf

foreach ($line in $FileResults)
{
if($line -like "SeManageVolumePrivilege*" -and $line -like "*$NTName*")
{
$ManageVolumePriv = 1
}

if($line -like "SeLockMemoryPrivilege*" -and $line -like "*$NTName*")
{
$LockPagesPriv = 1
}
}

Write-Host "Server:" $LocalSvr -foregroundcolor black -backgroundcolor gray
Write-Host " Lock Pages In Memory:" $LockPagesPriv
Write-Host " Instant File Initialization:" $ManageVolumePriv

}

}
 

Once you’ve created the ValidatePermissions.ps1 file and the Servers.txt file, open a PowerShell window and execute the script. In the example below, I’ve saved both files to the folder “C:\PowerShell”.

PowerShellResult

If any of the SQL Servers checked were lacking permissions, a “0” would return instead of a “1“. Rather than spending 20 minutes checking these servers manually, we’ve now confirmed the appropriate permissions in seconds! This script can be run anytime as needed with no further configuration.

Hopefully, this timesaver will allow you more of an opportunity to work on your 9-iron!